.avif)
Dynamic World was a result of a partnership between the Google Earth team and the World Resources Institute (WRI). The ambition was to use AI approaches to create a land cover map that was refreshed with every new pass of the Sentinel 2 satellite (approximately weekly) and distributed through Google’s Earth Engine. This contrasts with usual land cover maps that are done annually or sometimes less frequently and often are not available until several years after the data was collected.
It is a remarkable dataset – no one else does a near-real-time weekly land cover map – and, for large area coverage, it is incredibly useful. When looking at small areas every week, however, it struggles to meet expectations, so it is best used over longer time periods. Most impressive is that in addition to the landcover map, it also includes the % probabilities of each of the nine classes. This adds to the uniqueness of this dataset and greatly enhances the scope of how this data can be used.
Earth Blox Verdict
A greatly underused map layer from Google that is more powerful than it might first appear.
Pros:
✅ It is near real-time, with updates every week (no other land cover map is as up-to-date as Dynamic World).
✅ The coverage is global.
✅ It has a good historical record, going back to June 2015.
✅ It is free to access and has a commercial licence.
✅ The classification is supported by the % scoring based on all the classes, making it more transparent and versatile than other land cover products.
Cons:
❌ It is not really 10m resolution (probably closer to 30m).
❌ The classification can be inconsistent from scene to scene.
❌ For classes that have strong temporal signatures (like crop cover) then classifying over time should be more effective.
❌ As with all global maps, it can have a good global performance but may perform poorly in any specific location.
Technical Specs
- Ground sample distance (pixel size): 10m
- Coverage: Global terrestrial surface.
- Metric: Land cover class (9 classes), plus % score for each class in each pixel.
- Date range: From 27/06/2015 onwards. Updates at least every 5 days (more frequently at higher latitudes).
Expert review by Iain H Woodhouse
What kind of data is it?
The Google Earth team joined forces with the World Resources Institute (WRI) to create this map layer. The Google Earth team are the experts that bring you Google Earth and Google Earth Engine. They have a group of talented geospatial and satellite experts who focus on building tools for geospatial analysis. WRI is a global research non-profit organisation that generates many environmental datasets, including the Aqueduct Water Risk Atlas. In collaboration with several other organisations, they developed Global Forest Watch (GFW), a popular web application that uses Landsat satellite imagery to map forest changes (the data for which is also available on Earth Blox).
Dynamic World is a dataset developed with the aim of achieving globally consistent, high-resolution, near real-time (NRT) land use land cover (LULC) classification using deep learning on 10 m Sentinel-2 imagery. It includes class probabilities and label information for nine classes. A full scientific description of the methods and rationale are covered in this paper in Nature’s Scientific Reports journal.
The nine classes are: WATER, TREES, GRASS, FLOODED VEGETATION, CROPS, SHRUB & SCRUB, BUILT ENVIRONMENT, BARE GROUND, SNOW & ICE. The classes were chosen to align (as best they could) with the land use classes used in the IPCC Good Practice Guidance. This should make it easier when using the results to estimate carbon stocks and greenhouse gas emissions.
Traditional global landcover maps normally take months or years to produce, whereas a new Dynamic World image is created every 2-5 days (depending on latitude). Where the Sentinel 2 imagery is obscured by clouds, there is no data. Clouds and cloud shadows are removed using a combination of S2 Cloud Probability, Cloud Displacement Index, and Directional Distance Transform. When a scene has a high number of cloudy pixels, the entire image is ignored (rather than wasting resources trying to process a small number of useful pixels). This can lead to “gaps” in the data when looking at specific time points. In some tropical areas, you may find that even a year's worth of data will still have some gaps.
Per-pixel probabilities
As well as providing a classification map, Dynamic World also offers probability bands (as a %) for each class. The class assigned to the pixel is the class that has the highest probability. It is useful to be able to see the percentage because some pixels may have one dominant class, but for others, the classes may all score very similar values. You can therefore use the % values as an indicator of confidence in the classification. For example, imagine a pixel has been assigned to the TREES class. Sometimes that might be because TREES is 100% and the other eight classes are 0%. But the pixel would have the same class if TREES was only 12% and the other eight classes scored 11%. Clearly, the former pixel is a more reliable classification than the latter. In Earth Blox, it is straightforward to add a block that could, for instance, mask out any pixels that don’t have a high % classification so that users can be confident they are seeing only the most reliable results.
The other way to use the band of % values is to use this as an input into a supervised classification. This is particularly powerful if you are operating in a landscape where the 9 default land classes don’t especially align with the land cover types you want to identify.
How does the data perform?
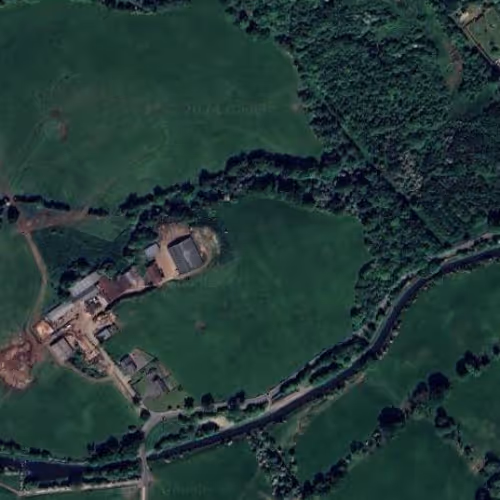
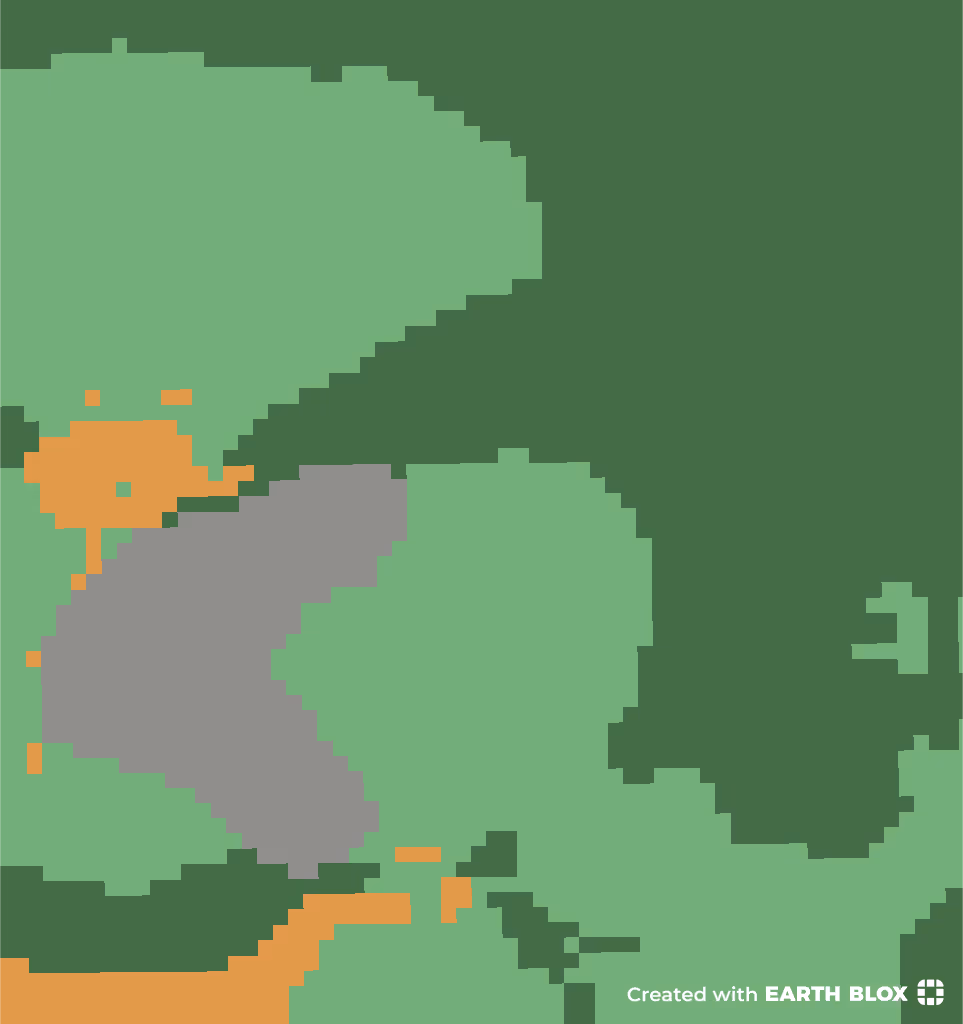
In areas of frequent cloud cover, looking at the Dynamic World data scene-by-scene (at high resolution) doesn’t always look so good. The following images help to illustrate the problems. In this case, the greens are GRASS and TREES, grey is BUILT, and orange is CROPS. The image covers an area of 600x600m. The first image is the Google Maps background satellite image. It shows a farm, fields and woodland. The second image is an animated GIF showing a sequence of (summer) images from Dynamic World.

The results are clearly quite variable. Non-removed cloudy pixels and differences in solar illumination are the likely causes of the variability. The missing scene is a totally cloudy day. You would be right not to be very impressed with these results. But that isn’t the best way to use DW. The best way to use DW is to look across a long time period (say, monthly) and take the mode (taking the mode gives you the most commonly classified class), the result looks much more convincing.
It still has some discrepancies from what you might expect from a visual interpretation of the high-resolution satellite image above, but it is now a more robust and repeatable map. It also starts to become comparable to other landcover products (such as the 10m ESA WorldCover). This method also works in the most cloudy areas, but you may need to collect data over a longer time period.
In all cases, when you are looking at a specific location or project area, we recommend you corroborate the results with a visual interpretation since stray artefacts can occasionally lead to quite poor results in some areas. In these cases, we recommend you start to tease apart the classification by looking at the underlying percentages. By way of example, the following images show the % score of four of the nine bands for the same test area used above. Clockwise from top left: GRASS, CROPS, TREES, BUILT. Unsurprisingly, CROPS and GRASS (the top two) are very similar – the algorithm is confident it is none of the other seven classes, but it is clearly less confident about whether it is GRASS or CROPS.
It is this ability to tap into the percentages that differentiates Dynamic World from other landcover maps.

What level of detail does it detect?
This data is not “10m resolution” as claimed, but rather, it is a 10m pixel size (or 10 grid spacing). It is very apparent that the deep learning results in some level of “smoothing” which means that the final map is not able to resolve targets at the 10m scale. From visual analysis, the performance is probably closer to 30m than 10m. From the animation above, it is also clear that consistency from scene to scene does not perform at a 10m pixel size.
Similar products
ESA WorldCover (10m): ESA land cover map for 2020/21 with global coverage – useful for agriculture, biodiversity and nature conservation, land use planning, natural capital accounting and climate change.
(North America Only) Land Cover of North America 2020 (30m): Land cover classification for North America for the year 2020.
Suggested alternatives
Use the supervised classification block to create your own classification using Sentinel 1 and 2 data. This will likely give you a higher-quality map optimised for your local conditions. You could also augment such a classification by using the DW data as another input band.
Read more Earth Blox dataset reviews
Iain H Woodhouse is Knowledge and Outreach Lead at Earth Blox and Professor of Applied Earth Observation at the University of Edinburgh. He specialises in active remote sensing, with over 27 years experience in academia and industry, and more than 100 publications. Iain has advised multiple UK government agencies on EO strategy and is former Chair of the UK Space Agency’s EO Advisory Committee.